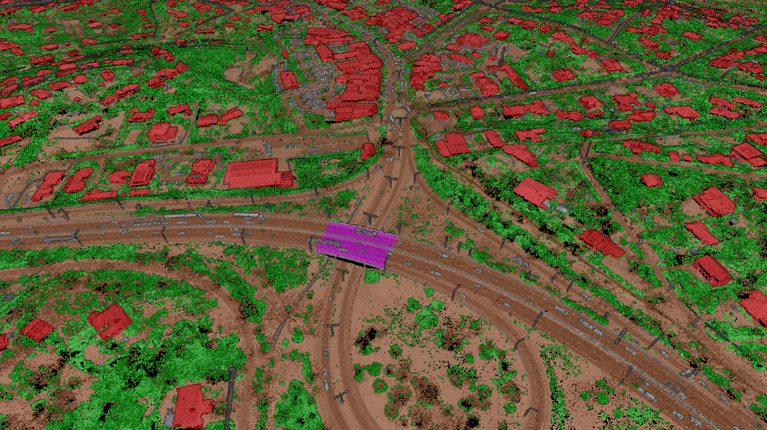
Aerial LiDAR has been the technology of choice for generating high-accuracy elevation datasets for many years. Aerometrex’s Airborne LiDAR sensors emit up to two million laser pulses per second, and each one represents multiple direct measurements of the three-dimensional location of the environment. The vertical component of each point within the resulting dense LiDAR point cloud can then be analysed to produce a wide range of elevation datasets, both raster and vector, which symbolise the elevation of the landscape in two dimensions, making it much easier to use them in standard GIS platforms. Depending on how you classify the underlying LiDAR Point cloud, elevation datasets can be produced that describe specific sets of features across the landscape.
Two of the most commonly used elevation products derived from Aerial LiDAR - Digital Terrain Model (DTM) and Contours - both describe the elevation of the ground surface and are extracted from points classified as ground, requiring at least Aerometrex’s Type 1 classification. These products are made possible as LiDAR has the ability to penetrate through vegetation and measure the ground surface below, thus providing an accurate measurement of ground surface elevation even below the tree canopy and revealing the regional topography of the landscape.
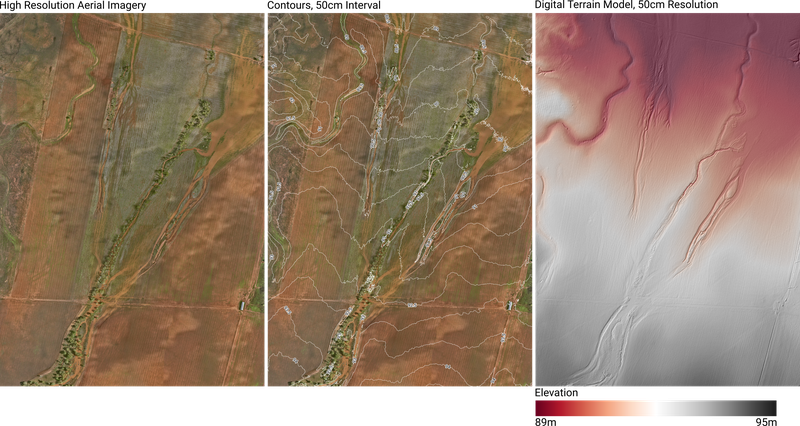
Figure 1. [Left] High-resolution Aerial Imagery. [Middle] 50cm Interval Contours. [Right] 50cm resolution Digital Terrain Model. Both the Contours and Digital Terrain Model are derived from the points classified as ground within the Classified LiDAR Point Cloud.
A Digital Terrain Model, also known as a Digital Elevation Model (DEM) or Bare Earth Model is a raster dataset where each cell (pixel) shows the ground elevation relative to sea level, derived directly from the points classified as ground within the point cloud. In contrast, contours are a vector dataset comprised of polylines that join points of equal ground elevation, revealing landforms and slopes, derived from an initial Digital Terrain Model. Both datasets can be used to understand regional or local topography to model surface water flow, understand flood hazards or measure site geometry for engineering and urban design works.
Elevation raster datasets can be generated incorporating all above-ground features (as well as ground) to make a Digital Surface Model (DSM). DSMs are also continuous raster datasets, which describe the elevation (above sea level) of all features across the landscape, generated by defining each pixel’s elevation value as the highest elevation within that cell (known as binning). The resulting DSM includes buildings, trees, other infrastructure, and the ground surface where it is visible from above. Both DTMs and DSMs show elevations above sea level, and by combining these two datasets the point cloud can be normalised in order to convert the point coordinates to height above ground rather than sea level. This essentially removes the effect of topography to produce a Digital Height Model (DHM). A DSM and/or DHM can be highly valuable datasets to understand the urban landscape for planning and environmental management.
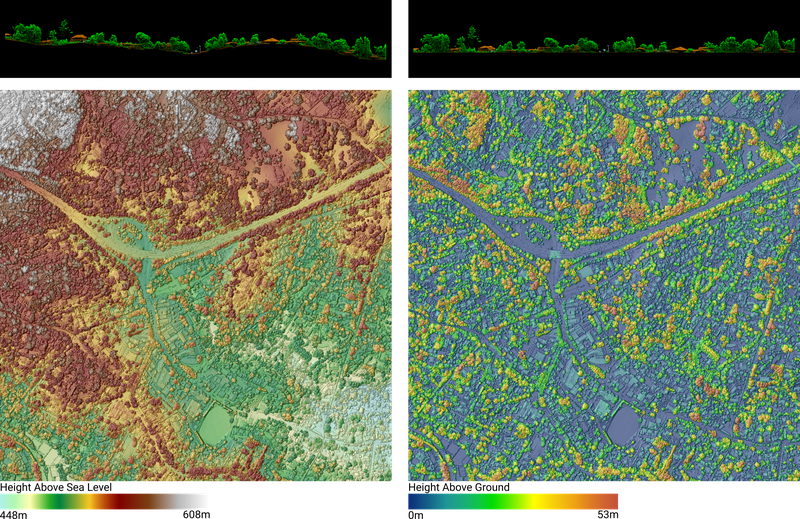
Figure 2. [Top left] A classified point cloud where the heights are relative to sea level. [Top Right] A classified point cloud that has been normalised to the ground surface to convert coordinates relative to ground level. [Bottom Left] A Digital Surface Model. [Bottom Right] A Digital Height Model of the same area.
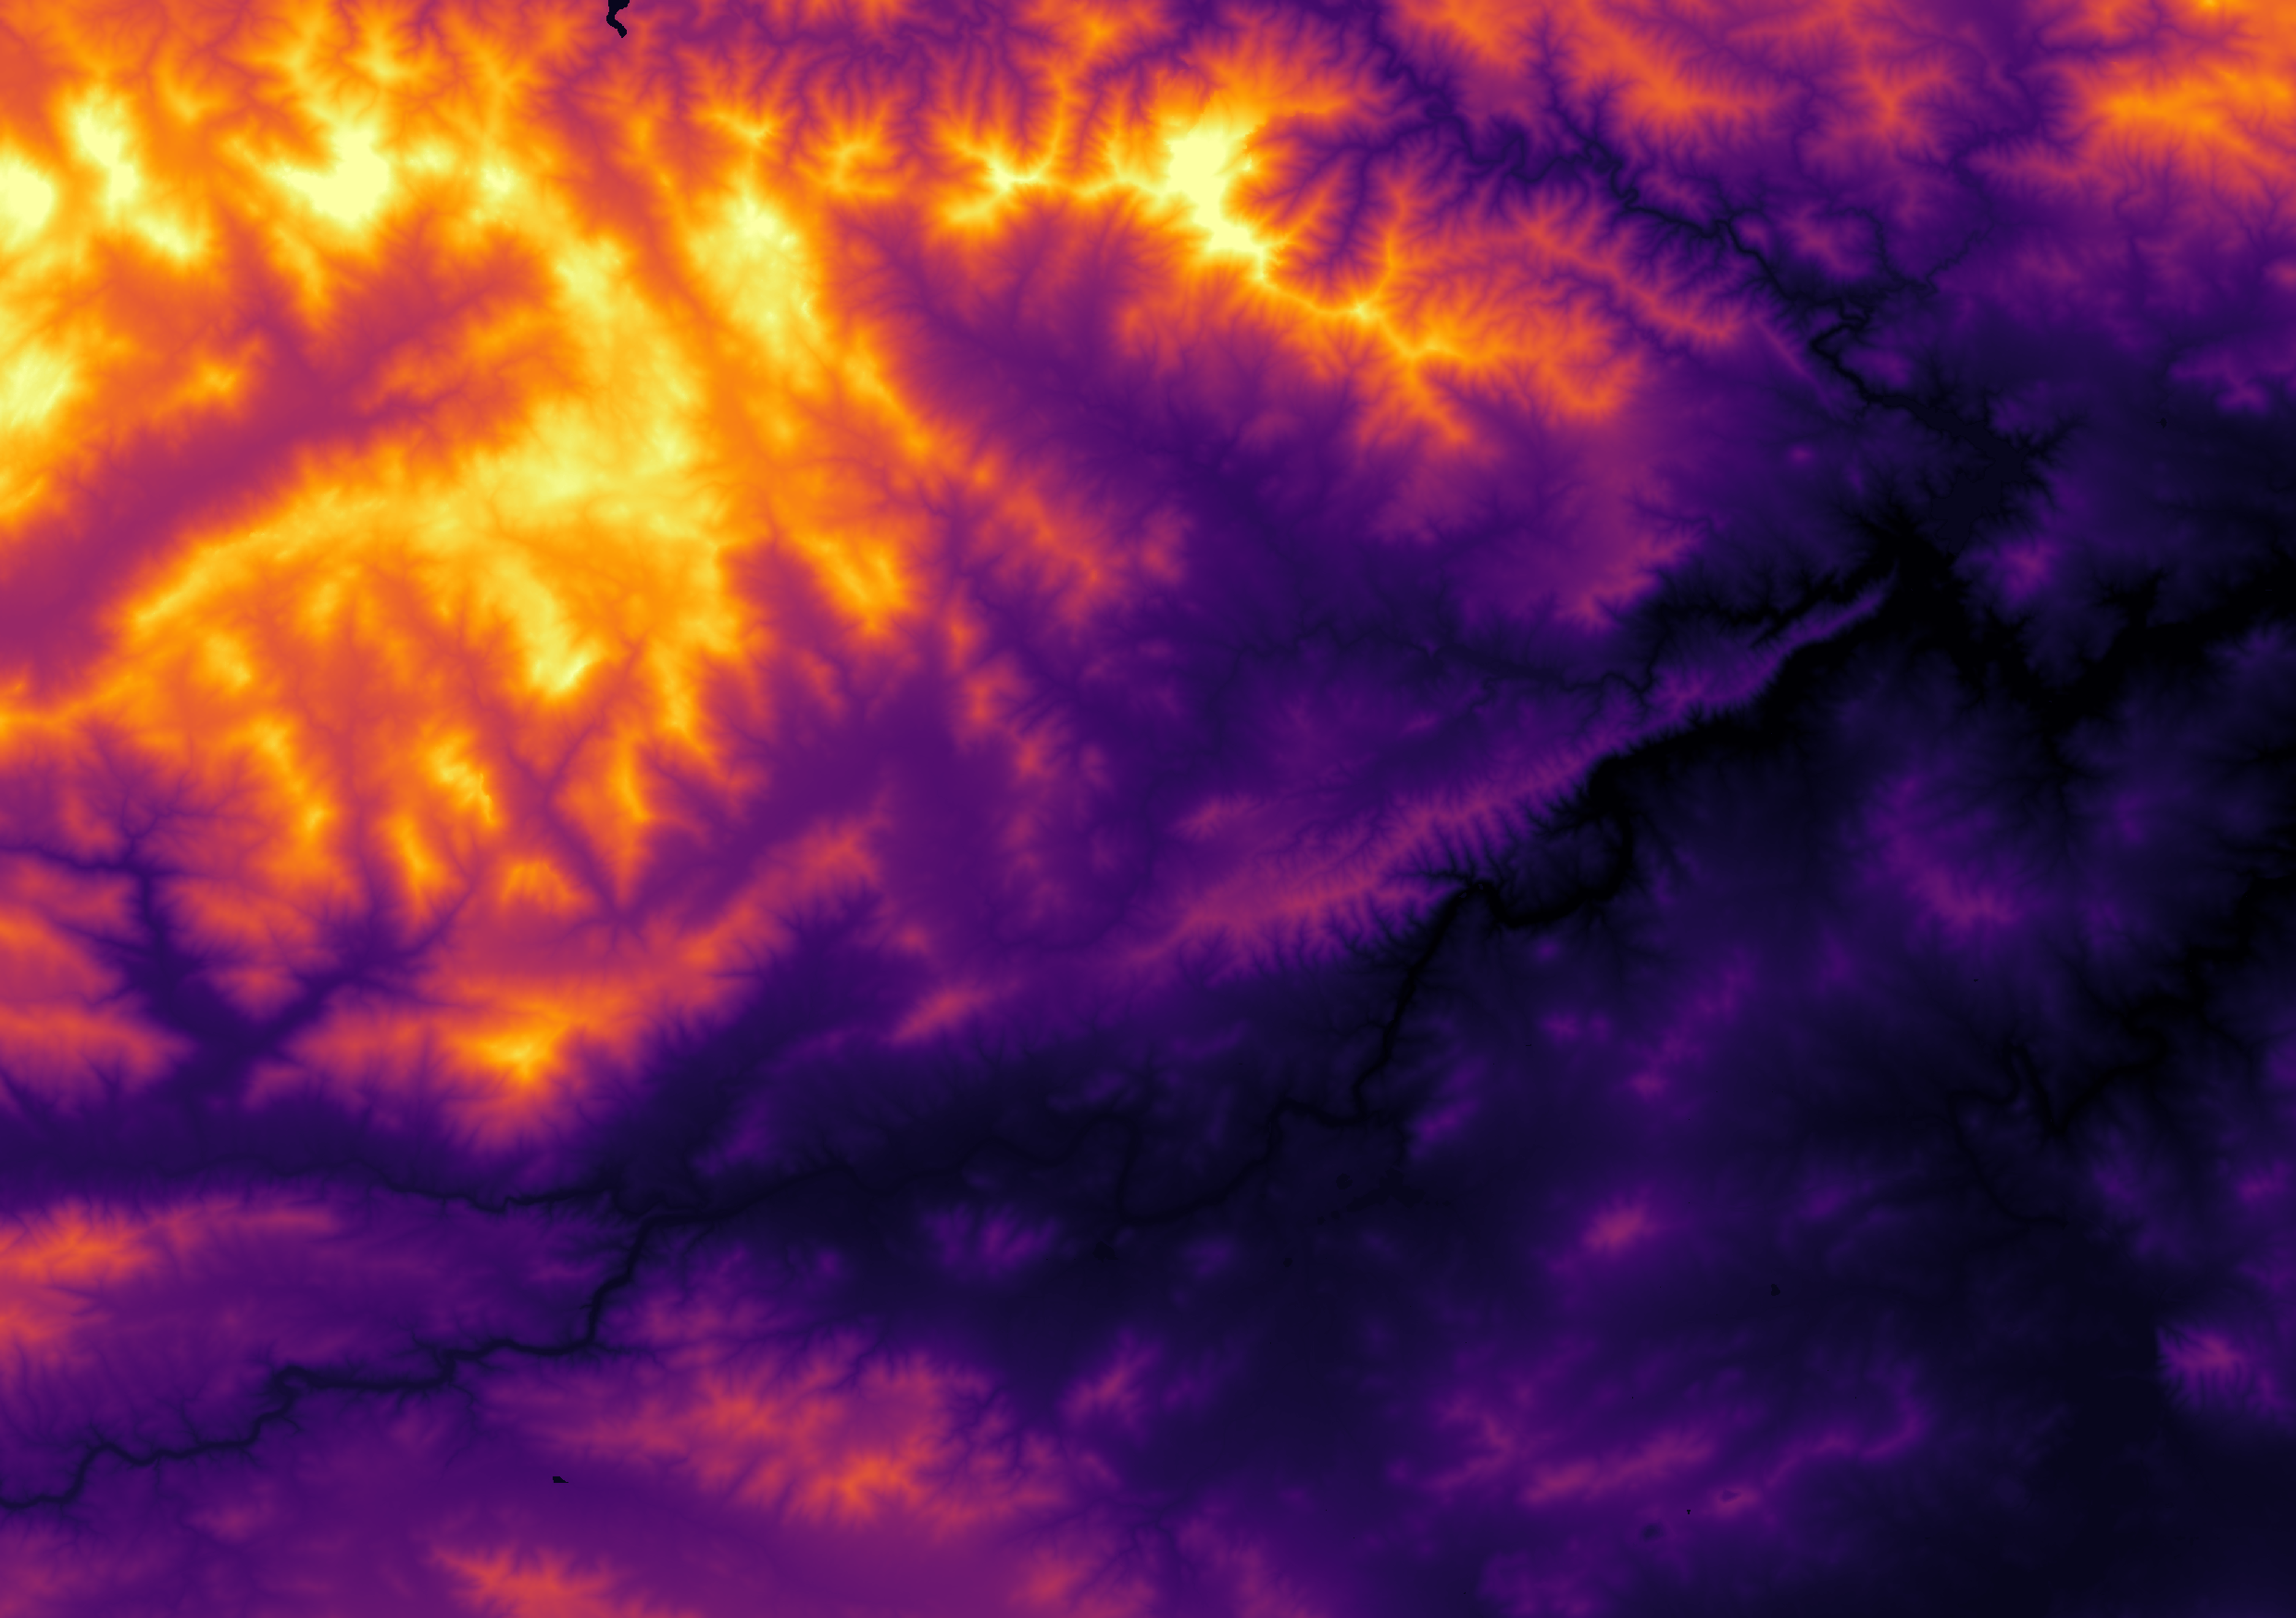
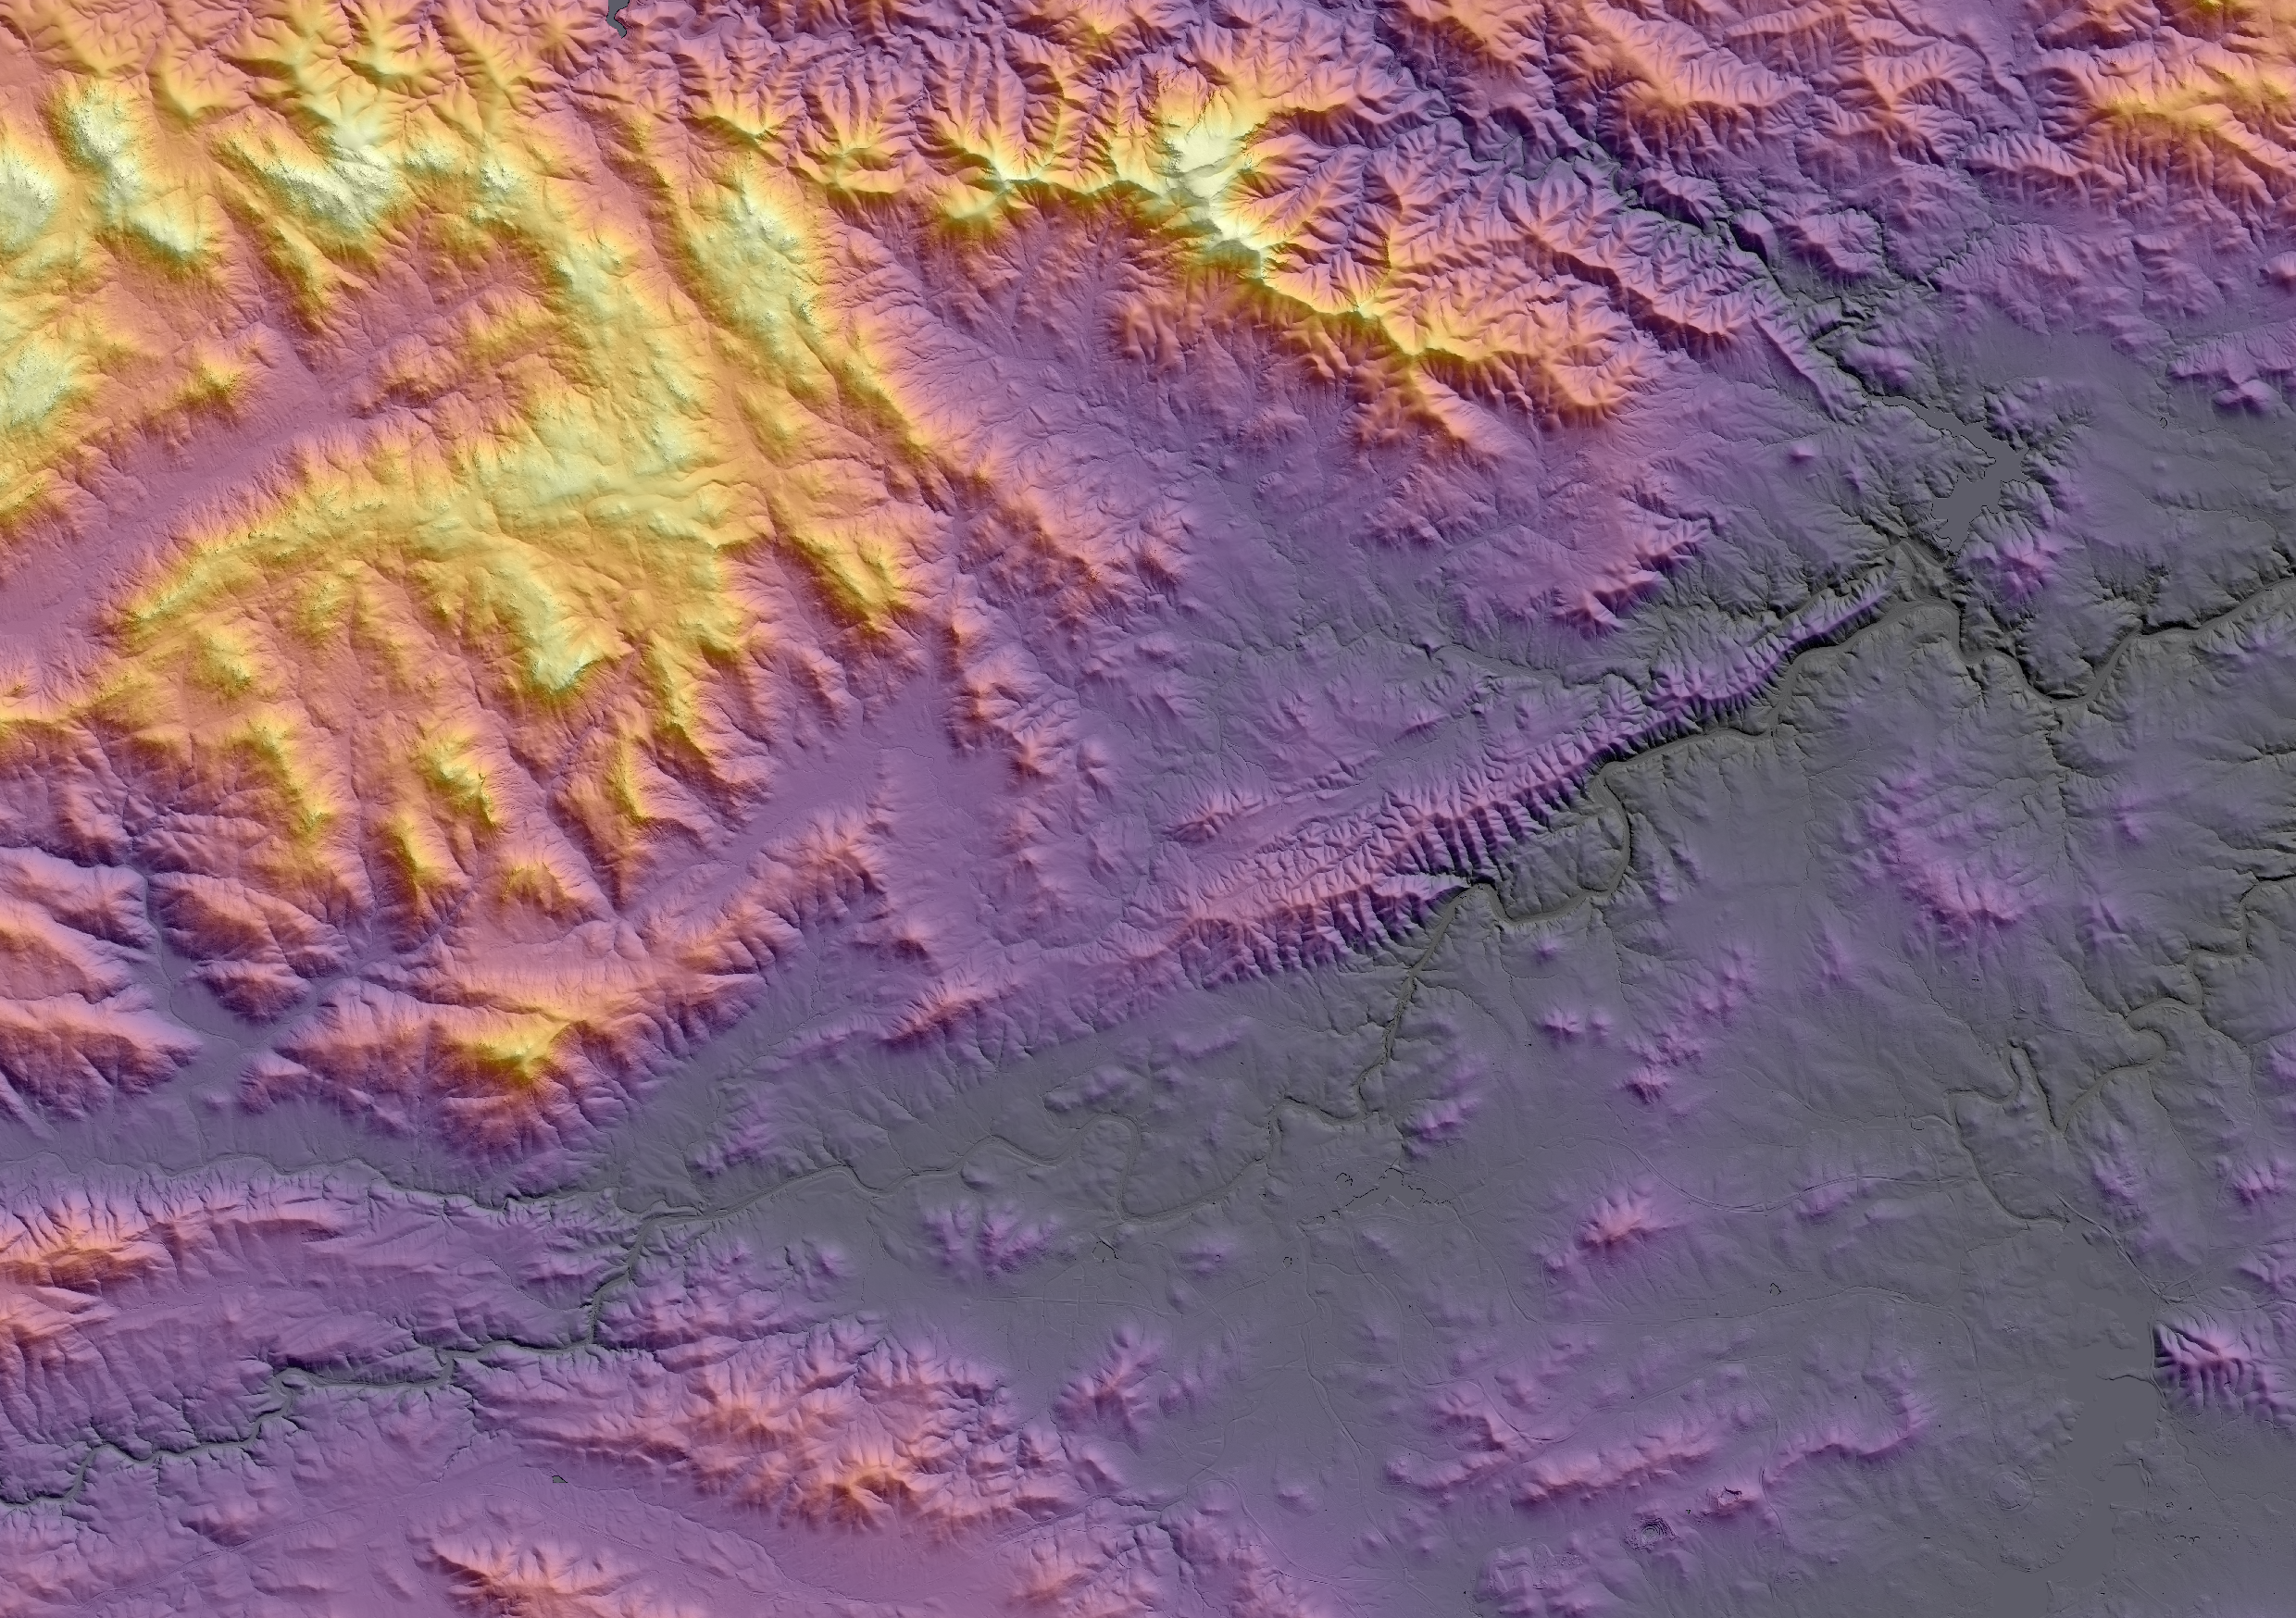
Although powerful quantitative datasets, elevation rasters such as DTMs, DSMs and DHMs can be very hard to visually interpret to identify specific features across the landscape. One way to increase how visually interpretable elevation datasets are is to apply a Hillshade or shaded relief algorithm. These algorithms apply virtual lighting effects to the elevation surface in order to simulate the shadows generated by the sun illuminating the environment to reveal the topography. A coloured hillshade map can be generated by placing the hillshade raster over the elevation raster and applying limited transparency. This makes it far easier to identify certain features within the dataset, while still providing the underlying quantitate height data which can be queried using a GIS platform.
Figure 3. below shows the application of Hillshade effects to reveal topographical features in a DTM.
Elevation datasets can be combined and analysed in various ways to generate additional insights beyond just elevation. For example:
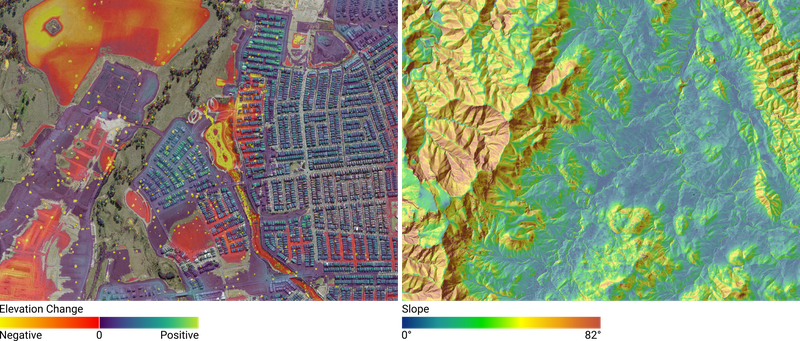
Figure 4. [Left] Elevation change calculated from two separate Digital Surface Models. Negative changes highlight earthworks and tree removal. Positive changes highlight where construction has taken place. [Right] A regional slope map of an area in ACT. Slope maps can be integral in applications for agricultural developments and land use permits.
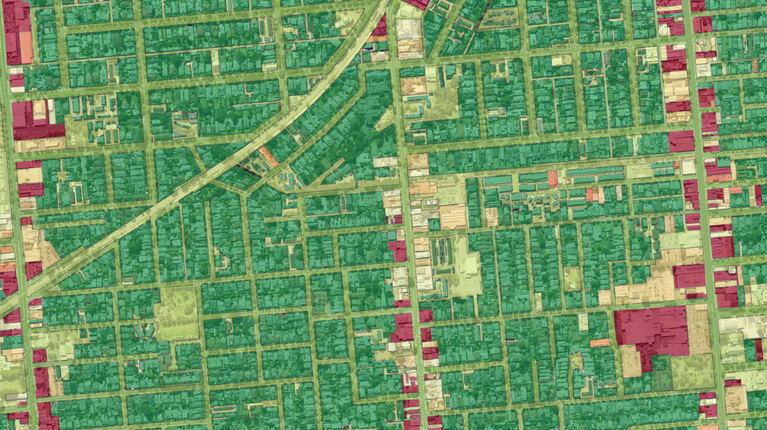
Elevation datasets can be made that describe the structure of specific features in the environment. For example, by utilising LiDAR point clouds that have been classified to Aerometrex’s Type 2 standard, highly accurate Building Height Models (BHM) and Canopy Height Models (CHM) can be made. These datasets describe the specific height of buildings and trees respectively, with no data being displayed outside of these features. Datasets like BHM and CHM can be highly valuable in supporting urban greening initiatives and management strategies by enabling urban planners and environmental managers to track the distribution of canopy cover versus hard surface cover in urban areas.
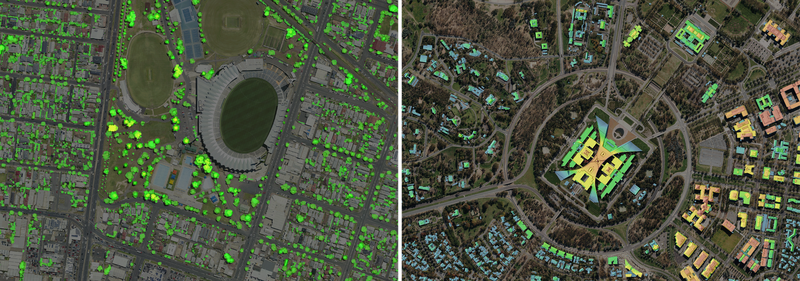
Figure 5. [Left] Canopy Height Model, Kardinia Park, Geelong. [Right] Building Height Model, Parliament House, Canberra. Both datasets are shown over aerial imagery base maps.
Contact our team using the form below and we'll reach out to discuss your requirements.