Aerial LiDAR has become an industry standard to accurately map the distribution and three-dimensional structure of vegetation across both urban and rural landscapes. Aerometrex can provide a wide range of vegetation management datasets including rasters, vectors and analytical reporting. These datasets are ideal for understanding the coverage, density, and structure of vegetation to generate informed management plans and insights relevant to commercial forestry, urban forestry, mine-site rehabilitation, natural capital monitoring, and more.
Through informed LiDAR survey design and point classification to Aerometrex's Tye 2 Standard or higher, our range of vegetation datasets can be derived from a single LiDAR survey.
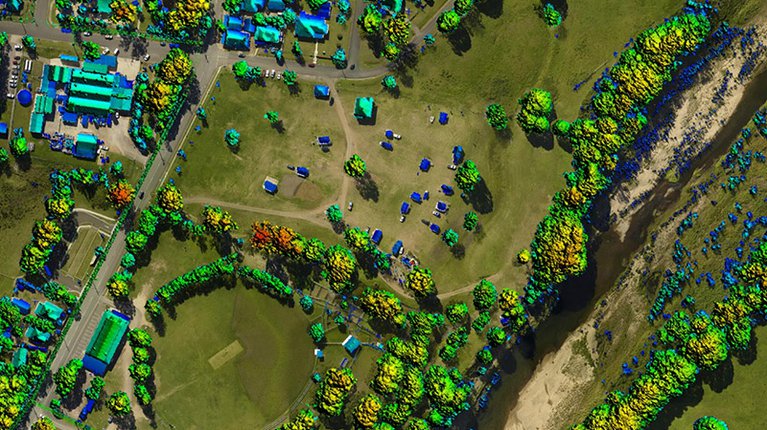
The Canopy Height Model (CHM) or Digital Canopy Model (DCM) is a raster dataset that describes the precise height (above ground) of the top of tree canopies. It provides valuable information and clear visualisation helping to locate tall/significant trees, track the growth of trees and identify trees that could potentially interfere with infrastructure such as power lines. These models can greatly reduce the time and effort required for asset maintenance.
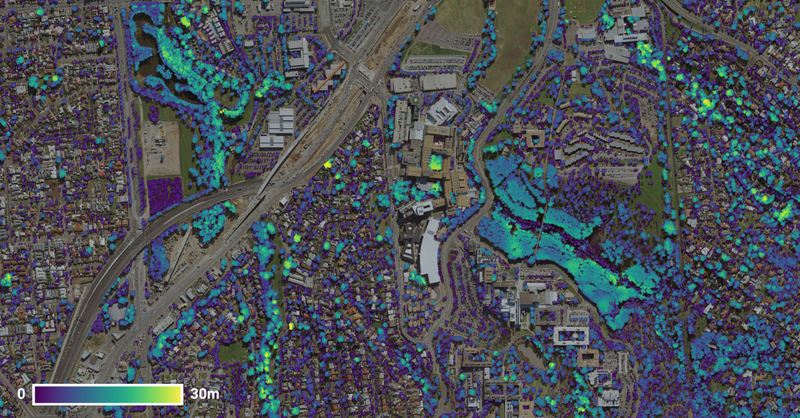
Figure 1. Canopy Height Model (CHM) of an area around Bedford Park, South Australia derived from our aerial LiDAR survey.
Another discontinuous raster, which is specifically designed for use within precision agriculture to manage natural capital and inform land management initiatives, is "Average Canopy Height by Unit Area". It describes the average height of the top of trees within a defined unit area.
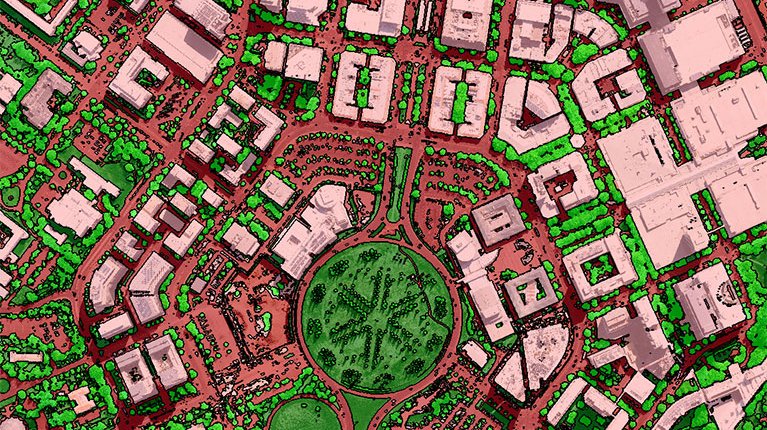
Aerometrex LiDAR surveys can help generate Foliage Coverage Maps (FCM) to provide a first-order estimate of the vegetation density across the landscape. These raster maps are produced by comparing the number of vegetation and ground LiDAR returns within each pixel. That ratio gives a fundamental measure of how much ground is covered by vegetation.
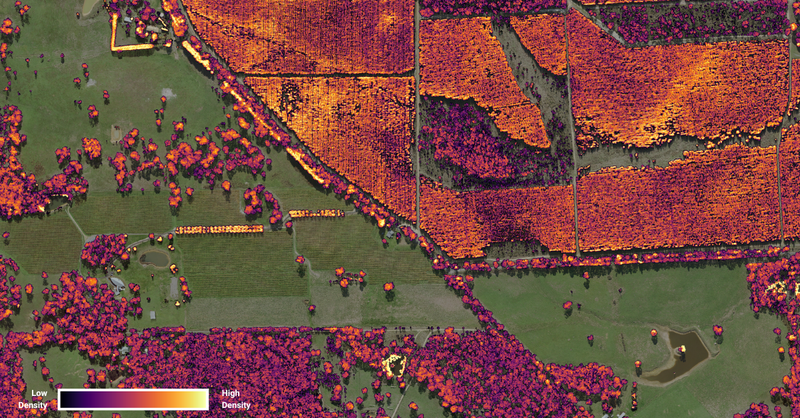
Figure 2. Foliage Coverage Map (FCM) of a location in Kuitpo Forest, South Australia
While FCMs describe the density across the entire vegetation column, Stratified Density Maps can be created for vegetation within specifically defined height intervals. These discontinuous rasters are generated by splitting the vegetation classified points into height layers and then approximating the density of vegetation within each. Another useful dataset that shows how continuous vegetation is from ground level to the top of the canopy is the Vertical Connectivity Index (VCI). These maps are great for understanding the stage of growth for managed forests and precision agriculture.
Customers can also use our Canopy Stratification Map to view the distribution of canopy coverage across these predefined height intervals. This vector dataset can help guide tree asset management by revealing the vertical distribution of tree canopy and quantifying the contribution of young versus established trees to the overall canopy coverage. It can be crucial for the development of tailored environmental policies combining planting initiatives and established tree preservation.
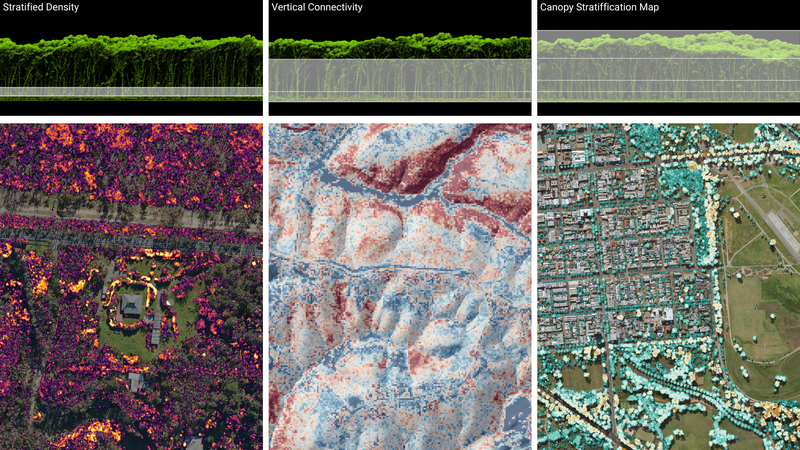
Figure 3. Stratified Density Map (left),Vertical Connectivity Index (middle) and Canopy Stratification Map (right) for height intervals defined in the tree profile above each.
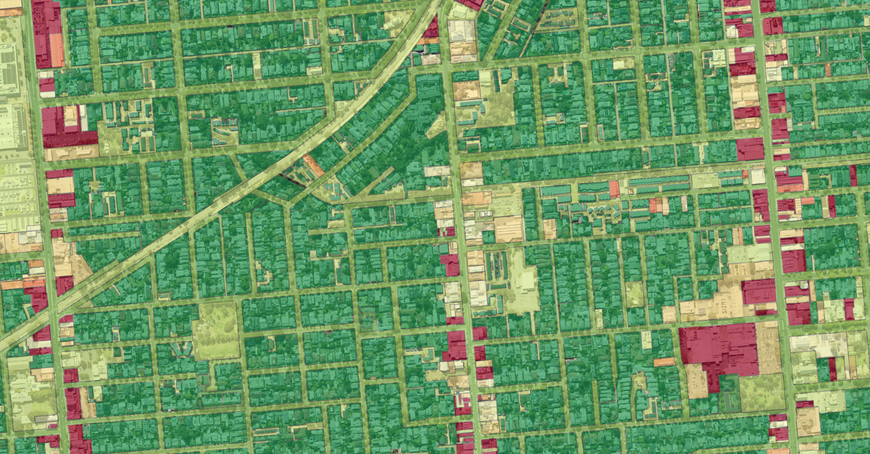
Aerometrex's LiDAR-derived Canopy Coverage Map shows the precise boundaries of tree canopies as a vector map, making it possible to extract their total area and the precise percentage of tree canopy coverage within an area of interest. Tree Canopy Coverage datasets can also be combined with cadastral, land use or land ownership datasets to provide statistical breakdowns of the distribution of tree canopy across the community. This can be used to develop targeted management policies and help local governments reach greening initiative targets.
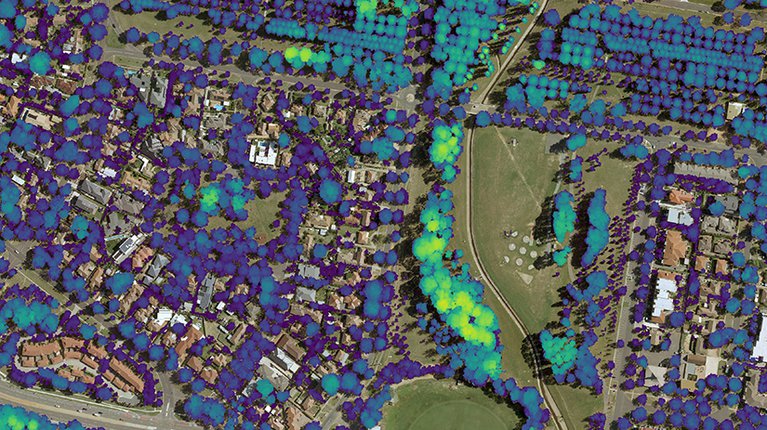
We can also provide a snapshot of the spatial distribution of tree canopy cover across an area of interest using our "Canopy by Unit Area" vector dataset. It is generated by calculating the percentage of pixels within each cell that are covered by trees. Experts can use this to formulate tree planting initiatives that will deliver the greatest immediate benefit to the community in areas that are in most need of increased tree canopy coverage. In agricultural settings, an understanding of areas with >20% tree canopy cover is used to develop carbon offset and credit schemes.
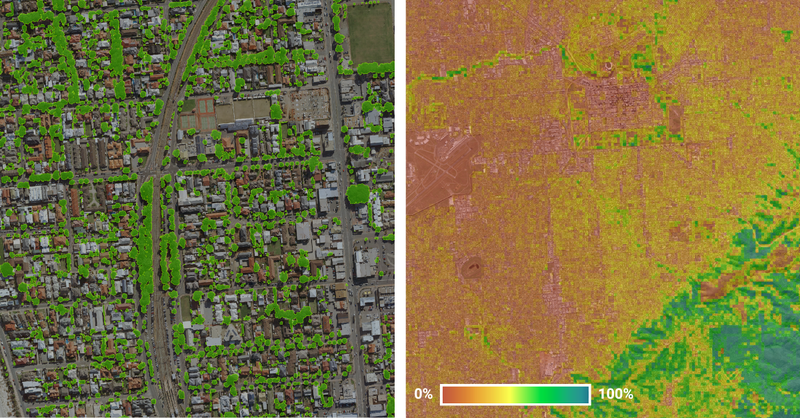
Figure 4. [Left] Canopy Coverage Map across a location in Brighton, South Australia. [Right] Canopy Coverage by Unit Area mapped across a large section of Greater Adelaide.
Derivation of vegetation metrics from LiDAR is accurate, cost-effective, and repeatable. It is also free of errors associated with perspective effects which are common to other technologies such as aerial imagery. Comparison of these datasets across time can help understand the degree to which tree canopy is changing across the urban landscape. This is critical to assess the effectiveness of tree canopy management and in adapting them to future challenges.
As shown in the video below, Aerometrex can provide analytical statistics describing the distribution of vegetation across an area of interest using client-supplied vector boundaries. Detailed statistics can be generated that summarise the extent and location of tree canopy gain or loss, and building construction or demolition can be spatially linked to tree canopy changes. These can be especially useful for organisations developing tree canopy management strategies or managing trees across large/multiple areas.
Common analyses include canopy cover breakdowns (by land use type or land ownership type), tree canopy change statistics and graphical reports.
Vegetation datasets such as the ones outlined above can be combined with a range of datasets that describe elevation/topography and built infrastructure across any area of interest to build a holistic, quantitative model of the environment, whether it be urban or rural, from a single Airborne LiDAR survey.
Contact our team using the form below and we'll reach out to discuss your requirements.